10M sellers
Amazon and Walmart seller identities, offers, listing footprints, and marketplace relationships.
IPSecure®'s Seller Investigation Registry combines proprietary seller, test purchase, supply chain, and authentication data into a relationship graph that surfaces actionable marketplace intelligence.
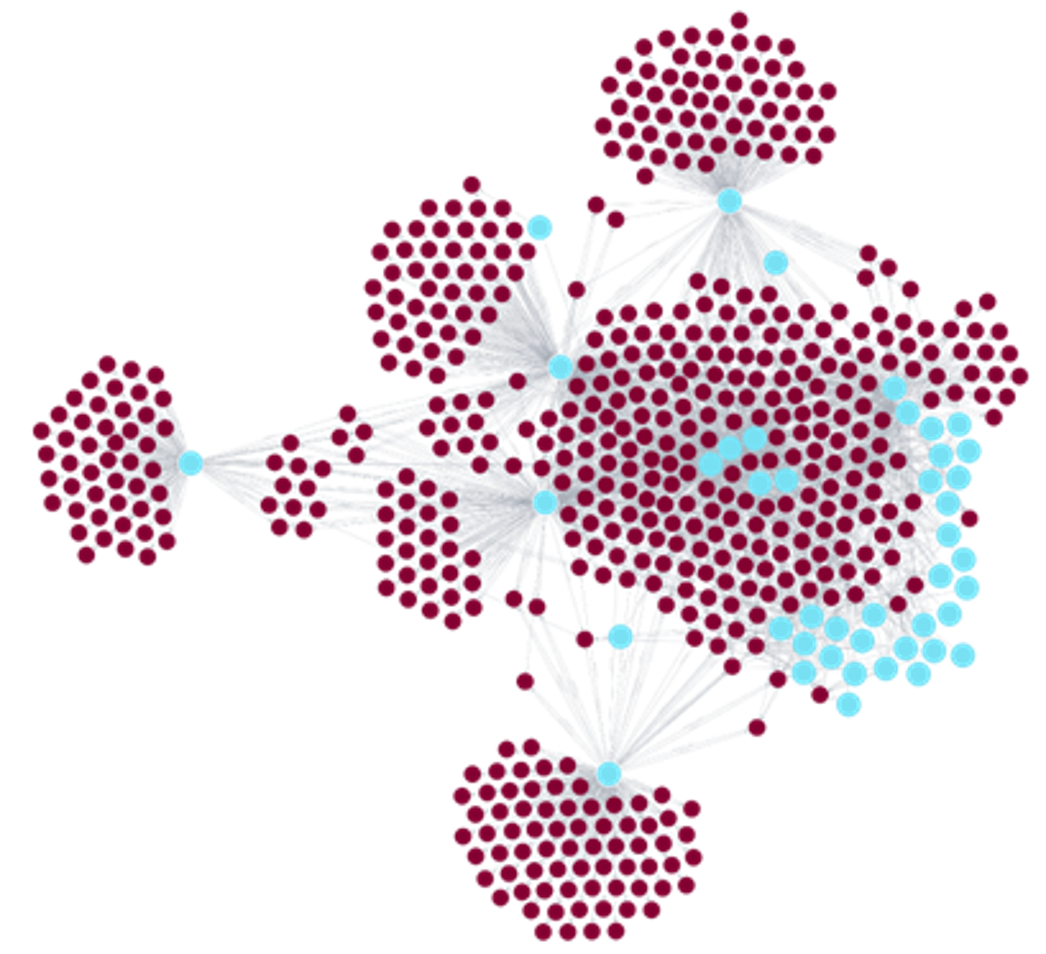
SIR continuously joins marketplace activity with evidence from the physical world. The result is not another seller list—it is a living investigative system built to reveal relationships, quantify exposure, and direct the next action.
Amazon and Walmart seller identities, offers, listing footprints, and marketplace relationships.
Thousands of physical products with confirmed infringement, authentication, and violation outcomes.
Client manufacturing, distribution, retail, and historical investigation intelligence.
Physical signatures, lot codes, packaging details, and expert product determinations.
When an enforcement produces a confirmed infringing outcome, that seller becomes a known bad actor inside SIR. From there, the registry measures the seller's recurring commercial overlap with every other seller operating across the same listings.
Which product listings does the known bad actor repeatedly offer on?
Which other sellers repeatedly operate on those same listings?
How frequently, simultaneously, and sustainably do those footprints overlap?
This is not heuristic labeling. It is statistical co-participation within the same commercial surface area.
If multiple sellers repeatedly sell on the same listings at the same time, they are operating within the same distribution network. SIR measures the frequency, duration, and density of that overlap so investigators can distinguish a momentary connection from a persistent relationship.
A single moment can show proximity. Persistent monitoring establishes confidence. Every new hour of shared marketplace activity adds evidence to the relationship model and improves the quality of the next investigation.
Repeated co-participation separates isolated contact from durable commercial relationships.
Seller groups sharpen as the registry captures more shared listings and concurrent activity.
The system becomes increasingly effective at identifying where known risk is likely to move next.
Brands that consistently enforce create visible containment zones around their marketplace presence. Seller clusters move away from enforced boundaries, exposing the measurable effect of sustained brand protection.
Clusters form around brands that initiate consistent enforcement actions.
The graph makes deterrence visible and connects enforcement activity to marketplace health.
Sellers do not remain inside one boundary. Broader monitoring reveals where they continue operating elsewhere.
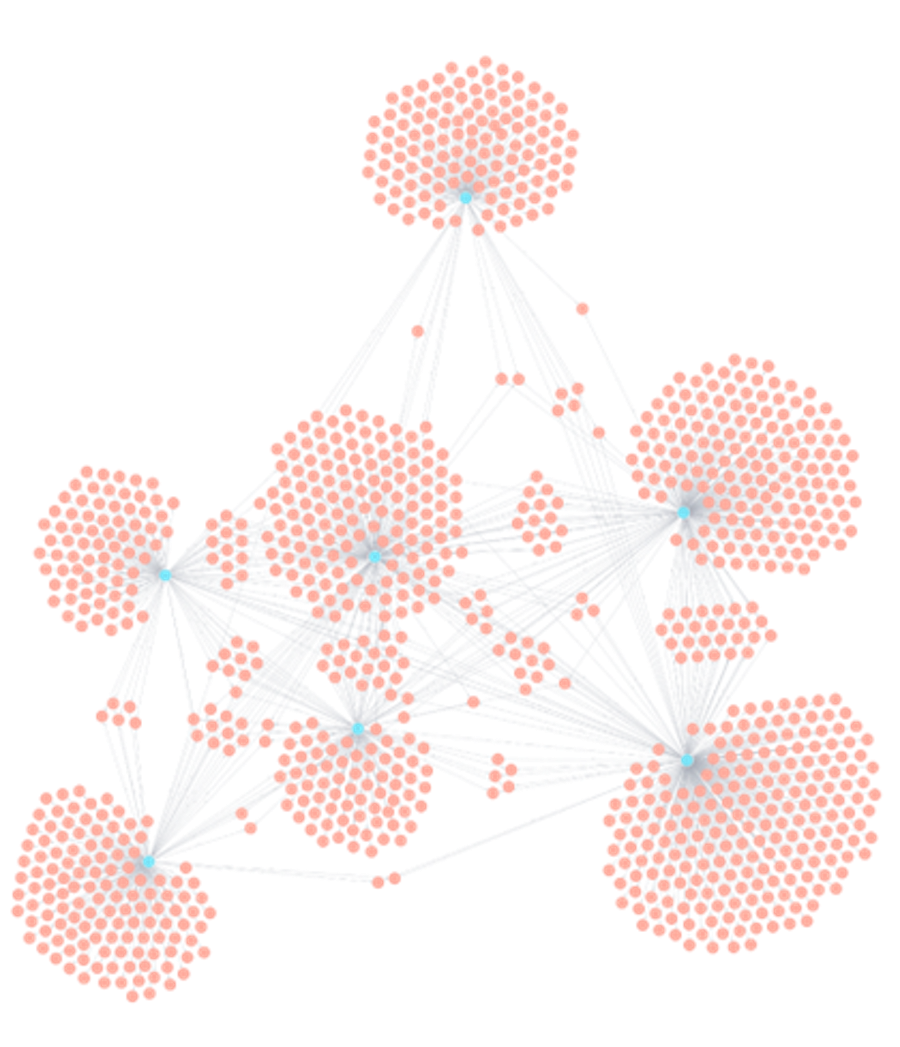
The full SIR graph shows the marketplace as it actually operates: brands, general sellers, confirmed bad actors, and the relationships connecting them. Enforcement-active buyerAI customers develop cleaner, more separated networks while unprotected brands remain saturated with known risk.
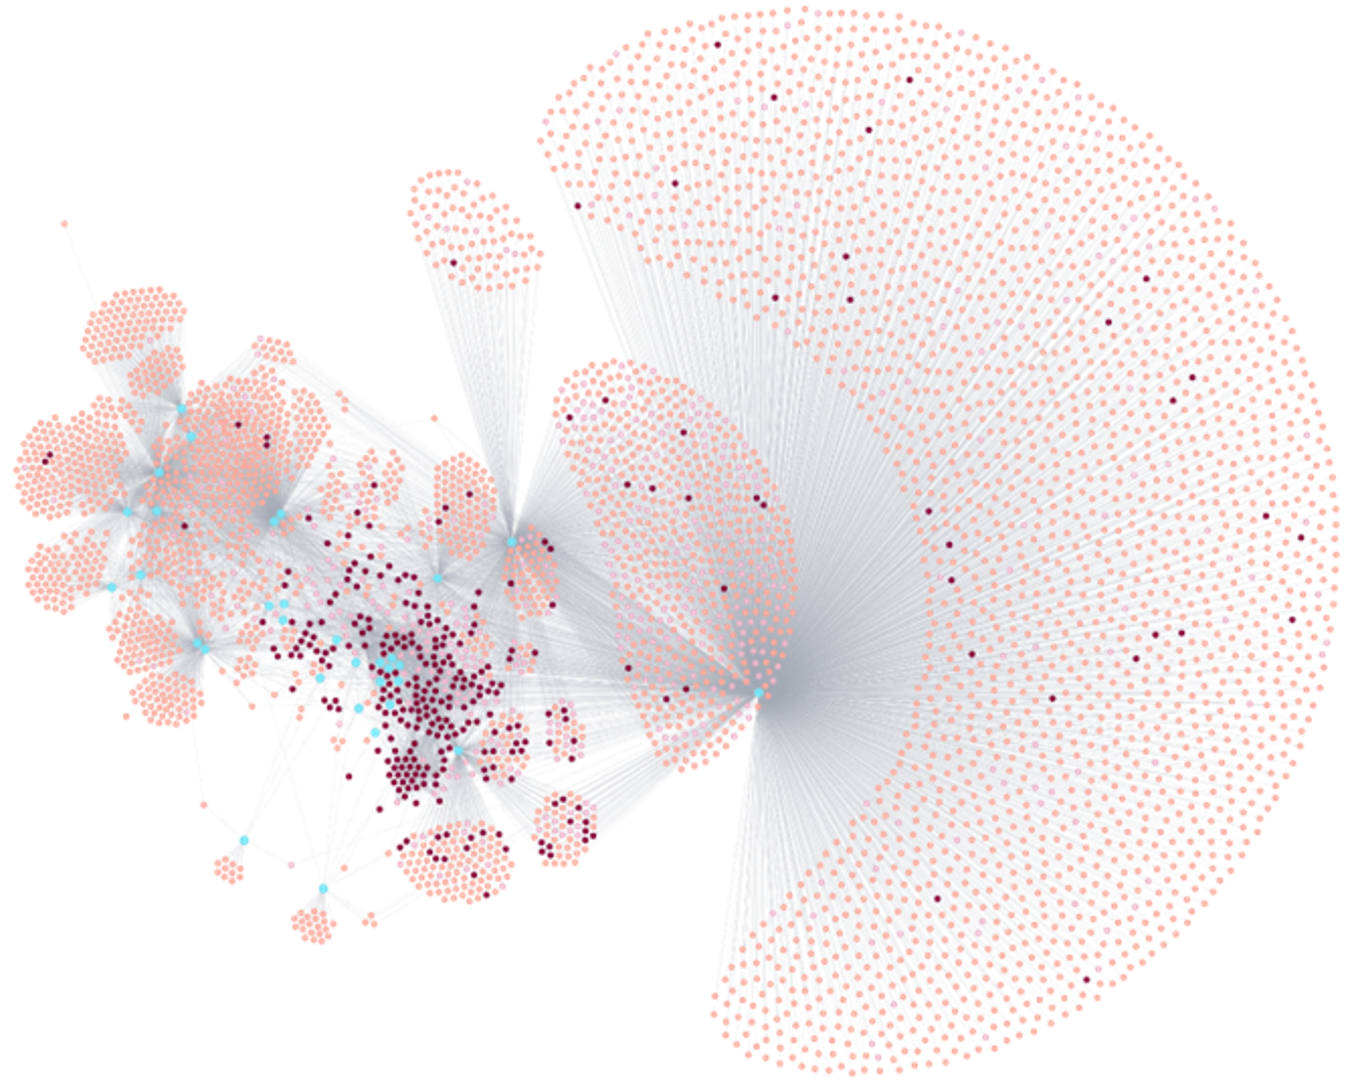
Representative anonymized SIR network. Each node and connection reflects marketplace activity and investigative evidence available within IPSecure.
Turn marketplace participation, physical evidence, and enforcement outcomes into a living intelligence system built around your brand.
Explore SIR ↗